Tue Mar 5 17:29:02 2019
The things we worked on this week is in bold. Below the bold items is a description of exactly what we took care of.
- Paper:
- Julie added Amy's edits.
- Julie let Kai know he is welcome to edit, too.
- Julie will also keep edits updated as they come in!
- Get loop working-- specifically XF:
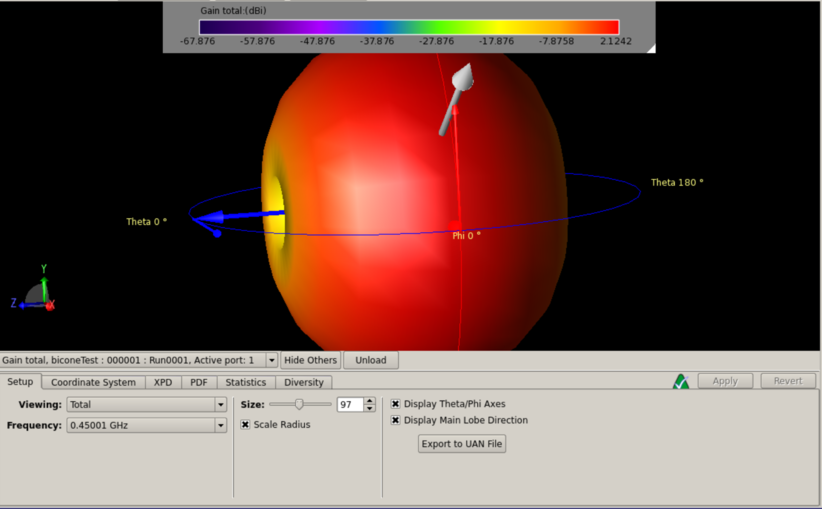
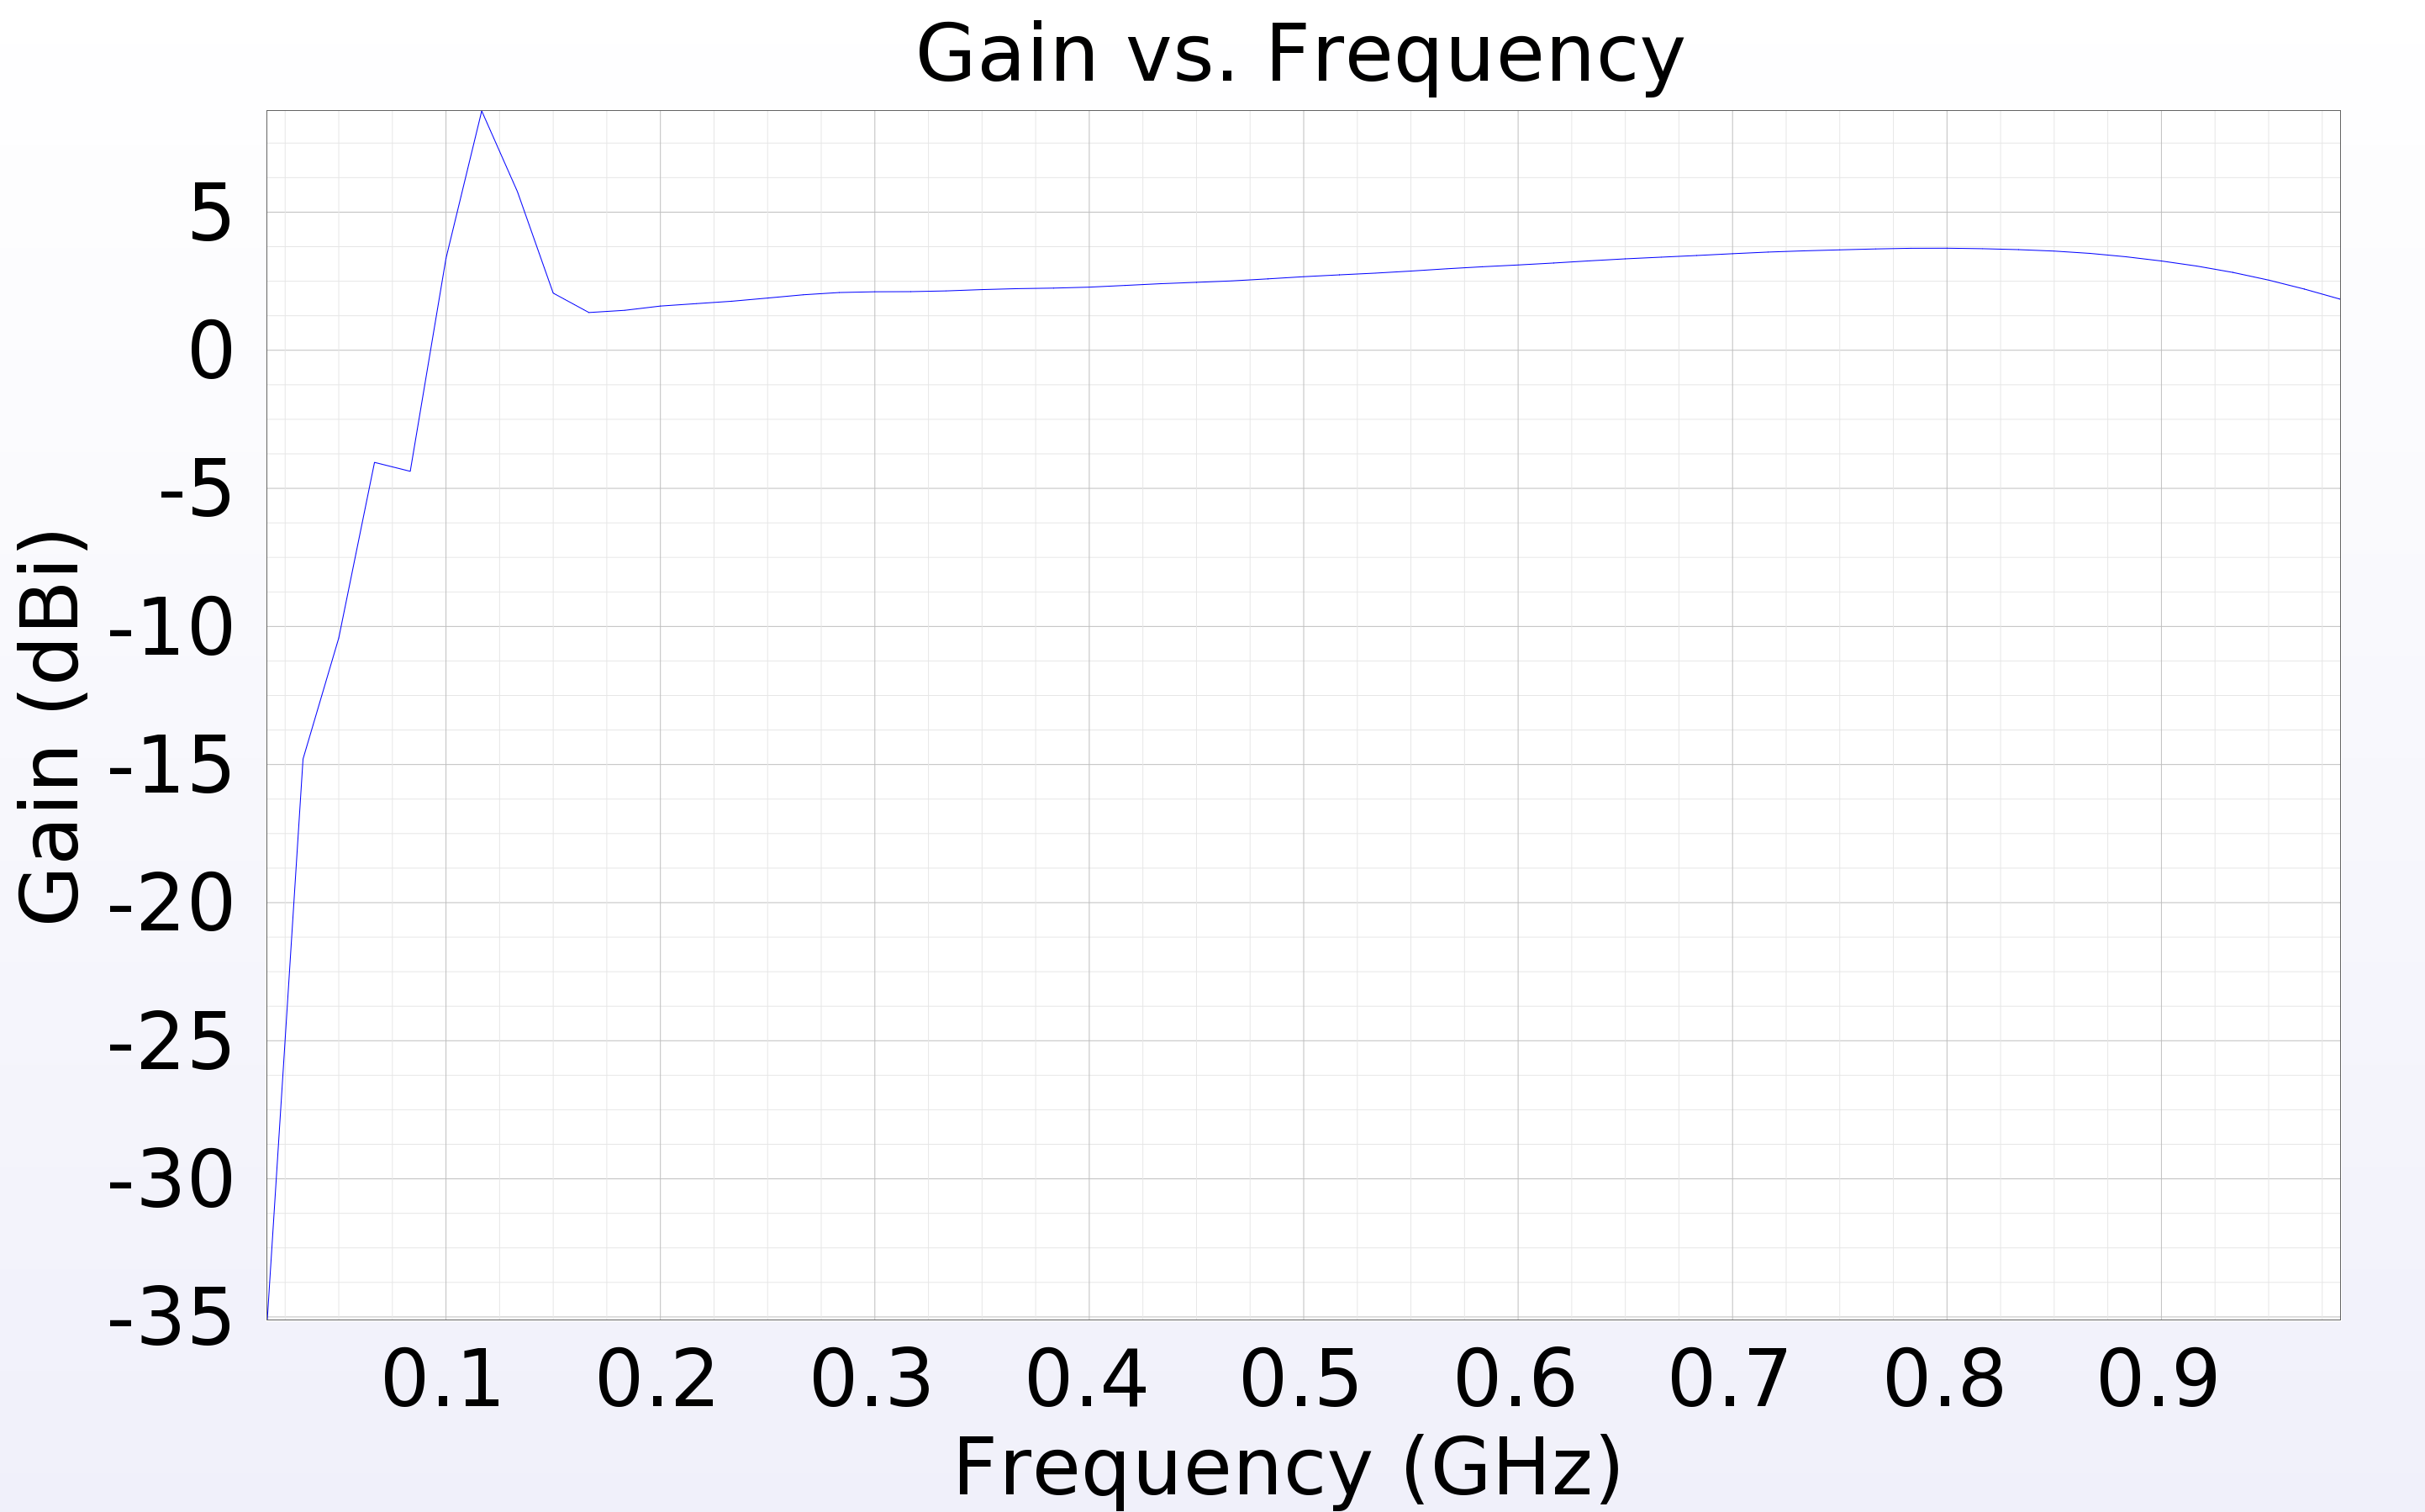
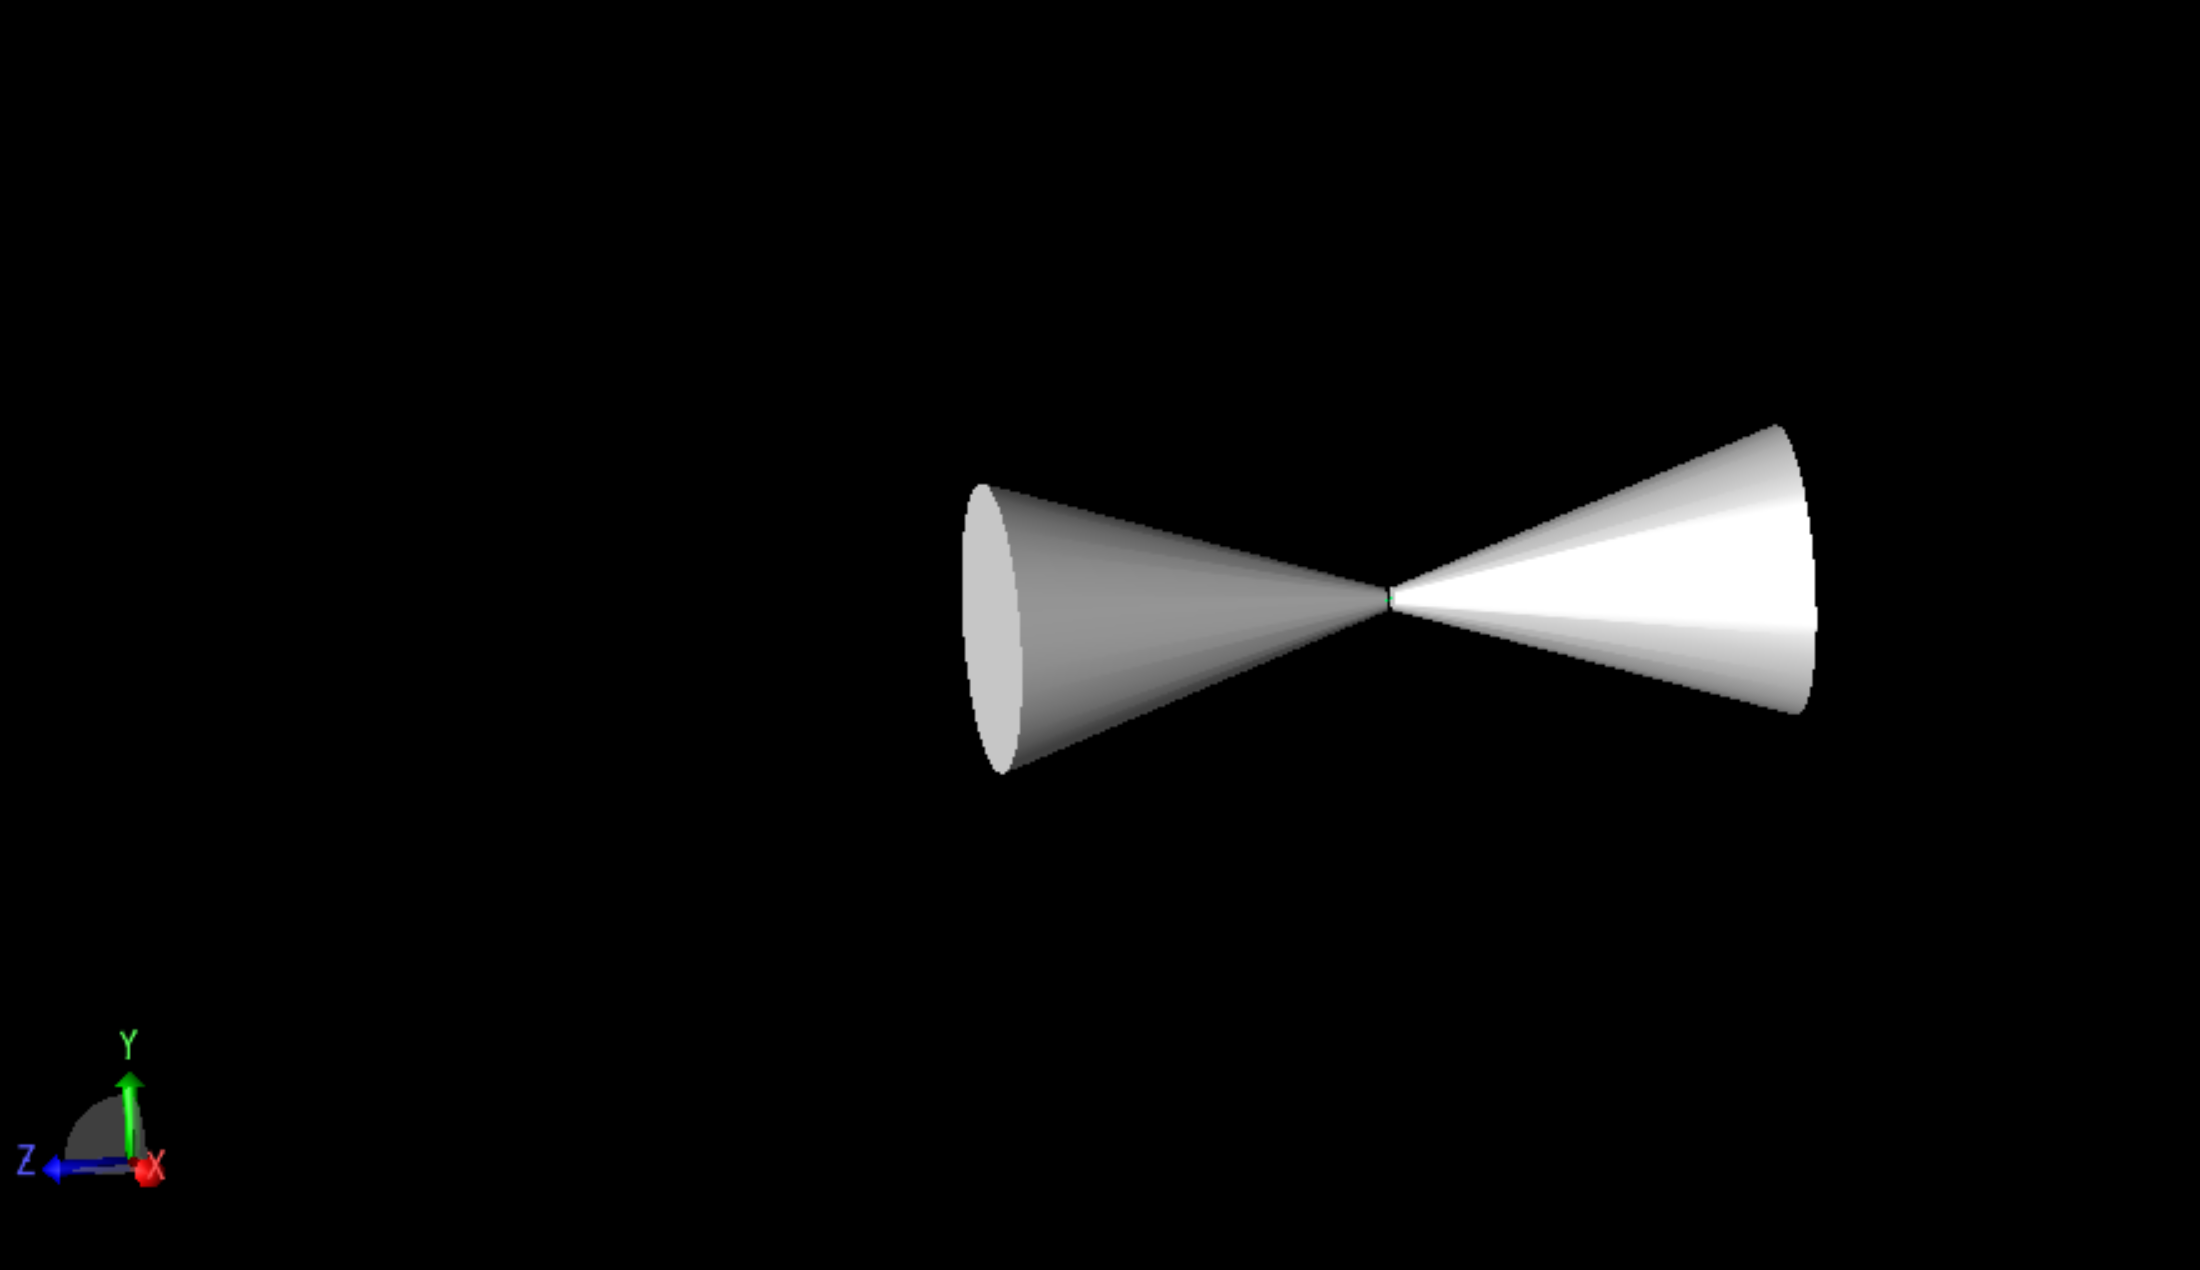
- Cade has now officially gotten reasonable outputs for his XF scripts. See the attached images for the XF outputs and associated CAD drawing. It seems to look like a reasonable gain pattern.
- The loop now works until AraSim. We are now getting the following AraSim errors:
- XF_Loop.sh: line 244: ./AraSim: No such file or directory
- XF_Loop.sh: line 244: ./AraSim: No such file or directory
- Julie is going to help Cade make sure that this directory is correct and that it has been compiled! More info to come.
- Test GA (Suren):
- I've been working on creating a gaussian fitness score with which I can test the performance of our genetic algorithm. The idea is as follows: We run the GA and get a generation of individuals. We provide their fitness score by simply taking the values {radius, length, angle} as the {x, y, z} coordinate in a 3D space. We can then use a 3D gaussian to output a value at that location, and use that number as our fitness score. The beauty of this method is that we can then plot the progress of our genetic algorithm each generation as a dot in this 3D space, and we can see it slowly snake to the center. Additionally, we can use more complex fitness scores, like one with a local maxima and a global maxima to see if it get's stuck in the local maxima. Below, I have an image I generated on python of a 2D section contour plot of a 3D gaussian in length-angle space. The dark purple is a lower value and the yellow is a higher value of the gaussian. The lines and dots hand-drawn on top are an idea of what it would look for like to start the GA at the red dot and see it's progress each generation until it reaches the center, shown by the white dots. Running this for our current roulette algorithm would make a very nice GA proof of concept plot for the paper, I believe!
.png.png)
- Gain pattern plots -- Make them 3D (Evelyn) & put on GitHub
- We need to figure out how to make a group Github. We have a lot of Githubs made by people and we need them all accessible from a group account. Right now the old dipole Github and the CalPoly stuff are linked to a group account. We need to find out how to get the Bicone account held by Max, and Evelyn's plotting code all on the group account: https://github.com/gp-antennas.
- Update: Evelyn and Max have contacted Brian to get their accounts linked. It looks like Amy, Brian, and Stephanie (Cal Poly) are the owners.
- Insert LR plot & Gain plot to loop (?)
- Edit bash script
- Update Github
- AraSim plots (Julie and Max) -- see #2 and #3 here: http://radiorm.physics.ohio-state.edu/elog/GENETIS/7 for details.
- Max and Julie have gotten sample data on Owens.
- located at /users/PCON0003/cond0068/ARA/AraSim/branches/AraSimLite/outputs
- Max and Julie have gotten sample programs from Jorge.
- https://github.com/toej93/AraSim_noise_calib/blob/master/readTree.cc
- https://github.com/toej93/AraSim_noise_calib/blob/master/M.readTree
- Julie installed root, and had Max source Julie's thisroot.sh files to run root on Owens.
- Max installed Arasim to his user.
- Next step: run plotting software given by Jorge.
- Update manual with things from Suren's last post here: http://radiorm.physics.ohio-state.edu/elog/GENETIS/8
|